
 PDF
PDF
Introduction
Land is the foundation of almost all resources used by
humans but human activity affects the planet on a scale so vast it can be
easily seen from space. As a result, more than 50% of the world’s land area has
been significantly converted to human-dominated land uses [1]. LULC change is a
complex phenomenon that directly and indirectly is influenced by multiple
socioeconomic and biophysical driving forces. The major driving factor includes
population growth, cropland expansion, and overgrazing [2,3]. The most notable
effects of LULC changes are severe soil erosion and land degradation. These are
the main reasons for the decline of agricultural production, the disappearance
of multipurpose indigenous tree species, diminishing of grazing lands, and
reduction in the abundance of medicinal plant species [1,4].
LULC changes have also led to the declining of forest
cover, water bodies and wetland areas whereas the increasing of cultivated and
built-up areas largely driven by population growth and economic development
[5–10]. In Ethiopia, extensive conversion of vegetation cover and expansion of
farmlands along with the ecological vulnerability (the ability of systems to
absorb changes of state variables, driving variables, and parameters) lands
have implications for large-scale Geo-ecological fragmentation and land
degradation [11].
In relation to this, in the highlands of Ethiopia,
LULC change is mainly caused by agricultural expansion, government land policy,
overgrazing, population pressure, investments and social unrest [12] led to
severe land degradation, biodiversity loss, deforestation, soil erosion, and
soil fertility loss [13]. In most cases of LULC change, croplands increase at
the expense of forest, woodland, and grasslands. For example, in the Central
Rift Valley of Ethiopia the area covered with forest, woodlands, grasslands,
and water has declined from 10, 33, 30, and 16% to 4, 18, 17, and 13% of the
total respectively. While the area cover for cropland increased from 11 to 47%
[12,14].
Likewise, in the Northeastern highlands of Ethiopia,
the forest lands declined from 4% in 1973 to 0.2% in 2015. The total forest
lands cleared between 1973 and 2015 amounts to 552 ha. This is 95% of the
forest cover that existed in 1973. Similarly, shrublands declined from 28% in
1973 to 25% in 2015. Meanwhile, croplands and rural settlements increased from
39 % in 1973 to 44% in 1986 and 54% in 2015 [3]. In contrast, [15] reported
that forest cover increases at a rate of 11 ha per annum from 1957 to 1998 in
Chemoga Watershed, Blue Nile Basin, Ethiopia. Due to rapid population growth,
and expansion of agricultural and plantation forests, the Ethiopian highland
has been severely degraded over the last three decades. Andit Tid watershed is
one of the catchments of the Soil Conservation Research Program (SCRP) of the
Amhara Regional Agricultural Research Institute (ARARI) in the Ethiopian
highlands. It began in 1982 by the Institute of Geography of the University of
Bern (Switzerland) in the Ethiopian highlands. The watershed lacks a complete
picture of LULC's change from its establishment to the present day. Therefore,
understanding LULC dynamics over time can help in projecting future changes in
LULC and instigate more appropriate policy interventions for achieving better
land management. Such an analysis that produces accurate information on land
cover is also required for both scientific. Since the LULC changes affect the
land productivity and livelihood status of the community, the present study
focused on identifying the changes in LULC change in Andit Tid watershed during
the years 1985, 1996, 2008 and 2017.
Materials and Methods
Study area
Andit Tid watershed is located at about 190 km North-East of Addis Ababa at the top of the eastern escarpment of the Ethiopian central highlands on the way to Dessie between coordinates of 39°43’E and 9°48’N (Figure 1). Administratively, Andit Tid watershed laid within the North Shewa Zone of the Amahara National Regional State. Elevation of the watershed ranges from 3022 to 3468 m a.s.l. The watershed receives a mean annual rainfall of 1651 mm. The minimum and maximum temperature of the area is 7℃ and 17℃, respectively. It has a bimodal rainfall regime with one dryer month (June) between Belg (first, short rainy season) and Kiremt (second, main rainy season). The watershed has wet frost highland agroclimatic zones. Major soil groups in the study area are Humic Andosols which cover most of the cultivated land and the area under heather tree and Lithosols in some steep concave slope areas of the watershed.
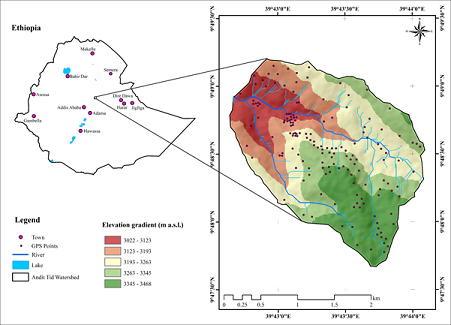
Figure 1: Location of Andit Tid watershed.
Data sources
Four Level 1 Landsat scenes of 1984, 1996, 2008, and 2017 with less than 10% cloud cover were downloaded from the U.S Geological Survey (USGS) earth explorer in Geo TIFF format. The imagery utilized was acquired during the dry season (December, January, and February) of the year in the study area (Table 1). LULC dynamics of Andit Tid watershed were analyzed for the last 33 years.

Table1: Remote sensing images used in the study.
Landsat imagery pre-processing
The Level 1 products were originally corrected for geometric and terrain distortion by the image provider using ground control points and the digital elevation model (DEM) [16,17]. Landsat images were pre-processed using ArcGIS 10.5 software by applying the basic image pre-processing techniques such as geo-referencing, mosaicking, and sub-setting of the image based on Area of Interest (AOI). All images were geo-referenced into the same map projection of World Geodetic System (WGS) 1984 Zone 37 N. To classify LULC types, a false-color grid composite image was developed. The major land class units used in the land cover analysis are shown in (Table 2).

Table 2: Descriptions of land use and land cover classes in the study area.
Land use/ land cover classification
Training samples were selected based on the
information obtained from ground truth data acquired through field surveys. For
past years, ground control points were obtained from topographic maps and
discussion with elders. As a rule of thumb, a minimum of 40 training samples
(ten times of the sum of all LULC classes) was chosen for each class [18]. The
Hybrid method, combining unsupervised and pixel-based supervised image
classification with maximum likelihood algorithm was used. Supervised image
classification is a recommended classification approach to yield good results
when satisfactory training data and detailed information about the study area
are available.
Post classification
Ground truth points (reference point) were collected
to assess the accuracy of the classified LULC classes. A confusion matrix
(overall accuracy, producer’s accuracy, and user’s accuracy) were derived from
the reference data and used for accuracy assessment. Confusion matrix which is
a cross-tabulation of the class labels allocated by the classified map and
reference data [19], is the most popular method of accuracy assessment [18].
After the classification and calculation of the area in hectares, a comparison
of the LULC statistics within and between classes and years was performed.
Change dictation
Post-classification comparison change detection was
made to determine the change in LULC between two independently classified maps
from images of two different dates. The rate of land cover change was
calculated for the three periods from 1984 – 1996, 1996 – 2007, and 2007-2017
using the following formula:
Rate of land cover changes (% yr-1) =
[(B-A)/t]×100 [equation 1]
Where A = previous land covers area (ha); B = recent
land cover area (ha); t = number of years between A and B.
The LULC change (%) was calculated using the following formula:
Transition matrix was computed for all identified land
cover classes using overlay functions in ArcGIS 10.5 software and Pivot Table
function in Microsoft Excel 2019 to analyze LULC trajectory (transitions
matrix).
Results
Accuracy assessment of land use/ land covers change
The least level of accuracy was calculated to be
85.35% for the 2008 LULC map (Table 3),
which could be considered to be an excellent result. Accuracy assessment is
used to check the quality of classified images based on the reference data used
for the classification. It is an important measurement used to assess how
accurately the classified image is in a match with the referenced data. The
accuracy assessment involves an error matrix that was built from two datasets
that are the remotely sensed classified map and reference data (Google earth,
previous imagery, or collected data from the field) used for the
classification. Kappa within error matric is always used to determine the error
encounter during the classification of satellite images and the classified map
will be considered as excellent if the Kappa coefficient (K) greater than 0.77.
The most significant accuracy assessment measurements are user, producer, and
overall accuracy.
All accuracy assessment measurements indicated that
the classified image exactly fits with the reference data. The overall
accuracies for the LULC map of Andit Tid watershed in 1984, 1996, 2008, and
2017 were 93.3, 94.34, 85.35, and 98.11%, respectively. It is computed by
dividing the total correctly classified number of pixels (i.e., summation of
the diagonal) by the total number of pixels in the matrix (total). Producer’s
accuracy, referees to the probability of reference pixels being classified
correctly that were 97.50, 100, 84.62, and 95.24% for 1984, 1996, 2008, and
2017 LULC map, respectively. User’s accuracy refers to the probability that the
pixel’s in the classified map represent that class on the ground that was
92.86, 93.02, 89.19, and 100% for 1984, 1996, 2008, and 2017 LULC map, respectively.
Grassland was largely misclassified in the 2008 LULC map that is 76.19% as
compared to the other land use types (Table
3).
Land Use and Land Cover
Regarding the LULC classification map of 1984, the
watershed was covered with zero plantation forest, while bushland, grassland,
and cultivated land have covered 52.2, 183.6, 227.52 hectares respectively (Table 4 and Figure 2). By the year
1996, the plantation forest cover has become 9.63 hectares and continues to
increase by 15.3 and 41.94 hectares by the year 2008 and 2017, respectively. In
the same year, the coverage of bushland, grassland, and cultivated land were
73.35, 134.19, and 246.24, respectively.
By the year 2008, the extent of bushland increased to
76.41 hectares from 52.2 hectares in 1984. In the same year the coverage of
grassland and cultivated land were 131.94, and 239.76 hectares, respectively.
By the recent year 2017 LULC type the cultivated land has been increased to
260.91 hectares from 227.52 hectares in 1984 or 239.76 hectares in 2008. The
extent of grassland coverage has been decreased continuously from 1984 to 2017,
whereas the plantation forest and cultivated land have increased. The long-term
LULC change from 1984 to 2017 indicated that the plantation forest and
cultivated land have been increased by 41.94 ha and 33.39 ha respectively. On
the other hand, the bushland and grassland coverage has been decreased by -7.29
and - 67.95 ha, respectively.
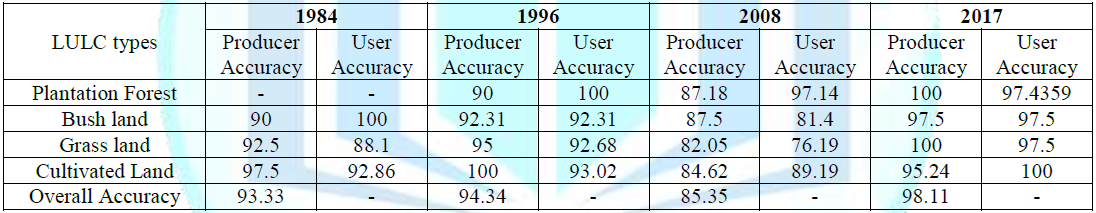

Table 4: Land use/ land cover change between 1984 and 2017 at Andit Tid Watershed.
Cultivated land was the most dominant land cover class
in Andit Tid watershed and has been continuously increasing due to the growth
of the population. The bushland coverage that was developed in the southern
part of the year 2008 has been completely disappeared in 2017 besides the
shrinking of large bushland in the southeastern part of the watershed. The
plantation forest started to develop in 1996 in the northwest part of the
watershed and continuously expand its extent in all directions up to 2017. Due
to the expansion of plantation forest and cultivated land through time since
1984, the bushland has become almost disappearing, except a little bit in the
central part of the watershed.
The rates of change in LULC are shown in Table 5. It is noticed that the plantation forest and cultivated land increase in coverage, but the change rate was slow during the year 1996-2008 which showed a decrease in the rate of change of cultivated land (-0.54 ha yr-1), and slow for plantation forest (0.47 ha yr-1). During the year 1984-1996, the grassland change rate was quite fast (-4.12 ha yr-1) as compared to other years. The change rate of plantation forest and cultivated land area was noticed increasing continuously during 2008-2017 with a net rate of change of 2.96 and 2.35 ha yr-1 respectively. Grassland indicated a decreasing rate of change for the whole study period, whereas the plantation forest showed an increasing rate of change for the whole study period.

Figure 2: LULC change map of Andit Tid watershed between 1984 and 2017.

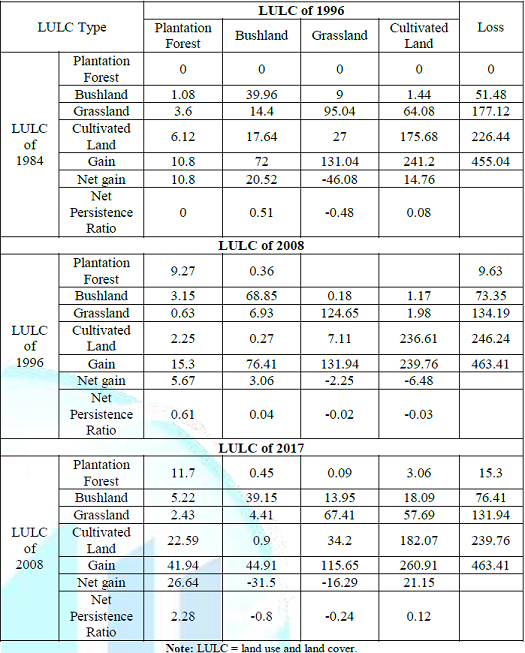
Land use and land cover transition matrix
The transition matrix Table 6 showed the conversion of one land cover class to another in
different years. An area of 183.6 ha of grassland cover has been converted to
plantation forest, bushland, or cultivated land area during 1984-1996,
resulting in a net increase of 10.80, 20.52, 14.76 ha for plantation forest,
bushland, and cultivated land area respectively. Area of 76.41 ha of bushland
and 131.94 ha coverage of grassland have been converted to either plantation
forest or cultivated land area during 2008-2017, resulting in a net increase of
26.64 ha of plantation forest and 21.15 ha of cultivated land. Between the
years 1996 and 2008 there have been net gains of plantation forest (5.67 ha)
and bushland (3.06 ha), whereas there was a decrease in the grassland by -2.25
ha and cultivated land by -6.48 ha. The increase of plantation forest in recent
years (2017) mainly comes from grassland cover that extends up to 183.6 ha
during 1984 and 134.19 ha during 1996.
Discussion
The major LULC categories identified are plantation forest, bushland, grassland, and cultivated land. Over the two decades and from other studies [20], similar trends of LULC changed at different rates of conversion were shown in all cover types. The plantation forest and cultivated land were dynamic in their changes. The cultivated land coverage increased from 1984 (227.52 ha) to (246.24 ha) in 1996 then decreased to (239.76 ha) in 2008 and again increased to 260.91 ha in 2017. The increment of cultivated land could be related to a high population demand for different cultivation practices, similarly, the grassland has decreased because of it. Andit Tid watershed is one of the most known cereals production areas in the country [21].
However, the increase in population imposes greater
pressure on the land and other natural resources in the watershed, which
results in the degradation of the resources in quality and quantity. Population
growth tends to cause the conversion of natural landscapes into use for the
needs of the community resulting in changes in the land use pattern [22]. The
population growth was very rapid and within this time in the watershed, there
was a very rapid LULC change [23]. Similarly, according to [24] in the Ribb
River watershed, there was the continued expansion of cultivated land and
settlement over the years which has brought a significant decrease in water
bodies, forests, and bush LULC classes.
This threatens both the local highland users through a
reduction in soil productivity and lowlands through sedimentation. The study by
[25] from the analysis of satellite images (between 1985 and 2001) has also
found that in the Lake Tana basin croplands have increased to about 4.2% in 15
years (between 1985/86 and 2001/03), which largely occurred at the expense of
grassland and shrubland. As [25] indicated land use/ land cover in the upstream
of Ribb and adjoining watersheds are being degraded contributing to the flood
hazard prevailing in the area. Since the Ribb Watershed has been subjected to
prolonged use for agriculture without conserving natural resources, forest
degradation, loss of biodiversity, shortage of fuelwood, and forage trees are
vegetation-related problems existing in the area [26].
There was a demand for agriculture and settlement
lands for the increasing population and obtaining fuelwood from open access
woodlands. This has led to the expansion of agriculture and settlement lands by
clearing bushlands and grasslands (Table 4). This implies that population
growth in Andit Tid watershed was one of the causes of conversion of bushland
and grassland into farm and cultivated lands within the stated periods and its
final consequence is the disturbance of the ecosystems of the watershed. Also,
in most East African countries, areas under canopy cover were converted into
grazing land, farmland, or charcoal production [21].
Similar studies by [27] in West Bengal revealed that
area under dense forests decreased from 58% in 1990 to 33% in 2000 but
increased to 39% in 2005, whereas open forest has increased from 10% in 1990 to
22% in 2000 but again decreased to 7% in 2005. The LULC change analysis of
Andit Tid watershed indicated that plantation forest coverage has been
increased continuously from 1984 (zero ha) up to 2017 (41.94 ha), whereas the
grassland coverage has been decreased continuously from 1984 (183.6 ha) up to
2017(115.65 ha). Bushland coverage increased continuously from 1984 (52.2 ha)
up to 2008 (76.41 ha) and then decreased from 2008 to 2017 (44.91 ha). Due to
the Andit Tid watershed development and rehabilitation for a long time by
different organizations, the plantation forest has been increased. Expansion of
plantation forestry both industrial and non-industrial on currently
uncultivated and sloping lands is one strategy to overcome land degradation on
the Ethiopian highland [28].
Moreover, Ethiopia has been a global leader in
landscape restoration, including a recently launched, massive tree-planting
campaign. Coupled with a renewed effort to protect remaining standing forests
(and other ecosystems of value), this will provide immediate benefits to rural
land users. In this study, grassland has been decreased significantly and
continuously from 1984 to 2017 that could decrease the role of such land-use
types to ecosystem services such as carbon stock and sequestration [29].
The land is very much intertwined with human culture
and identity in the watershed. It is also the main asset that farmers have to
accumulate wealth. Accordingly, the size of the land that they own and the
level of security they have in their holdings affect a household's income, and
their incentive to work and to invest in it [30]. From the researcher's
personal experience and observation and discussion with the community in the
area, farmers did not have enough land and they have not practiced the use of chemical
fertilizers because of the high cost. Instead, they try to expand their plot by
clearing bushland and grasslands near their plot of farmlands [21]. The
farmers, because of lack of land, plow steep slopes with no more products.
Their farming system has been the most ancient type and has no attached
technique for managing soil loss. Thus, for the land to be secured and used in
a long and sustainable manner the landholding system should be private.
However, the landholding system in the study area in particular and in the
country, in general, has been in the hands of the government for a long time.
Indeed, the change was related mainly to anthropogenic factors.
Conclusion
The main characteristics of the LULC changes observed
in Andit Tid watershed imply a reduction in the total amount of bushland and
grassland and a significant increase in cultivation and plantation forests.
This shows the dynamic conditions of land cover change in the study area. The
demand for agriculture and settlement for increasing population and expansion
of agriculture led to the clearing of bush and grasslands in Andit Tid
watershed. These changes continuously alter the spatial patterns of the
landscape and greatly modify the entire landscape of the watershed. As the area
needs urgent action, sustainable land management approaches should be
integrated with the traditional farming and non-farming uses of land in the
watershed. Combining practical action with research can help a practice to be
supported with scientific evidence.
Acknowledgments
Debre Birhan University, Ethiopia is duly acknowledged
for financing this study.
Data Availability
The data used to support the finding and conclusion of
this study are included within the manuscript.
References
- James W.
Humans are taking over, and we’re putting the world’s ecosystems at risk. 2016.
- Suneela T and Mamatha G. Detection of Land Use and
Land Cover Changes Using Remote Sensing and Geographical Information System
(Gis) Techniques (2016) Int J Electr Electron Data Commun.
- Agidew AA and Singh KN. The implications of land use
and land cover changes for rural household food insecurity in the Northeastern
highlands of Ethiopia: the case of the Teleyayen sub-watershed (2017) Agric
Food Secur 6: 56. https://doi.org/10.1186/s40066-017-0134-4
- Ashebir WY, Marc C, Kelboro G and Dessalegn W. Land
Use and Land Cover Changes and Their Effects on the Landscape of Abaya-Chamo
Basin, Southern Ethiopia. Land (2018) 7. https://doi.org/10.3390/land7010002
- Hussien AO.
Land Use and Land Cover Change, Drivers and Its Impact: A Comparative Study
from Kuhar Michael And Lenche Dima of Blue Nile And A wash Basins of Ethiopia
(2009).
- Deka J. Khan LM. and Tripathi PO. Study on Land
Use/Land Cover Change Dynamics through Remote Sensing and GIS – A Case Study of
Kamrup District, North East India (2014) J Remote Sens GIS. 55-62.
- Ganasri BP and Dwarakish GS. Study of land use/land
cover dynamics through classification algorithms for Harangi catchment area,
Karnataka State, India (2015) Aquatic Procedia. 4: 1413-1420. https://doi.org/10.1016/j.aqpro.2015.02.183
- Hailemariam S, Soromessa T and Teketay D. Land Use and
Land Cover Change in the Bale Mountain Eco-Region of Ethiopia during 1985 to
2015. Land (2016) 5: 41. https://doi.org/10.3390/land5040041
- Liping C, Yujun S and Saeed S. Monitoring and
predicting land use and land cover changes using remote sensing and GIS
techniques-A case study of a hilly area, Jiangle, China (2018) PLoSOne. https://doi.org/10.1371/journal.pone.0200493
- Shawul A and Chakma S. Spatiotemporal detection of
land use/land cover change in the large basin using integrated approaches of
remote sensing and GIS in the Upper Awash basin, Ethiopia (2019) Env Earth Sci 78:
141. https://doi.org/10.1007/s12665-019-8154-y
- Tefera B, Ayele G, Atnafe Y, Jabbar MA and Dubale P.
Nature and causes of land degradation in the Oromiya Region: A review (2002)
Socio-economics and Policy Research Working, Int Livest Res Inst.
- Adenew TA, Jaspervan V and Verburg HP. Land-use and
land cover changes in the Central Rift Valley of Ethiopia: Assessment of
perception and adaptation of stakeholders (2015) Appl Geogr 65: 28-37. https://doi.org/10.1016/j.apgeog.2015.10.002
- Gessesse B and Bewket W. Drivers and Implications of
Land Use and Land Cover Change in the Central Highlands of Ethiopia: Evidence
from Remote Sensing and Socio-demographic Data Integration (2014) Ethiop J Soc
Sci Humanit 10.
- Birhan AM and Assefa A. Land use/land cover changes
and their environmental implications in the Gelana sub-watershed of Northern
highlands of Ethiopia (2017) Env Syst Res 6.
- Woldeamlak B. Land covers dynamics since the 1950s in
Chemoga Watershed, Blue Nile Basin, Ethiopia (2002) Mt Res Dev 22: 263-269. https://doi.org/10.1659/0276-4741(2002)022[0263:lcdsti]2.0.co;2
- USGS.
Landsat 7 Science Data Users Handbook (1998) USA.
- USGS.
Landsat 8 Data Users Handbook. 2016.
- Hu T, Liu J, Zheng G, Li Y and Xie B. Quantitative
assessment of urban wetland dynamics using high spatial resolution satellite
imagery between 2000 and 2013 (2018) Sci Rep 8: 1-10. https://doi.org/10.1038/s41598-018-25823-9
- FAO. Map Accuracy Assessment and
Area Estimation: A Practical Guide Rome (2016).
- Mueller D. Land-Use Dynamics in the Central Highlands
of Vietnam: A Spatial Model Combining Village Survey Data with Satellite
Imagery Interpretation (2002) Agricultural Economics. 27: 333-354.
- Amare T, Yitaferu B and Hurni H. Effects of ‘“Guie”’
on Soil Organic Carbon and Other Soil Properties: A Traditional Soil Fertility
Management Practice in the Central Highlands of Ethiopia (2013) 5: 236-244. https://doi.org/10.5539/jas.v5n7p236
- Amare T. Population and Environment Interaction: The
Case of Gilgel Abbay Catchment, Northwestern Ethiopia (2013) J Environ Res
Manag. 4: 153-162.
- CSA (Central Statistical Agency Ethiopia). Population
Projection of Ethiopia for All Regions at Wereda Level from 2014-2017, Federal
Democratic Republic of Ethiopia, Central Statistical Agency (2013).
- Nurelegn M. Land Use/Cover Dynamics in Ribb Watershed,
North Western, Ethiopia (2014) J Nat Sci.
- Birru Y.
Land Degradation and Options for Sustainable Land Management in the Lake Tana
Basin (LTB), Amhara Region, Ethiopia (2007) Centre for Development and
Environment.
- Temesgen G, Amare B and Silassie HG. Land Degradation
in Ethiopia : Causes, Impacts and Rehabilitation Techniques (2014) 4: 98-105.
- Luca M. Change Detection in Landuse/Landcover Using
Remote Sensing and GIS Techniques: A Case Study of Mahananda Catchment, West
Benga (2013) Int J Res Manag Stud 2.
- Bishaw B. Deforestation and land degradation on the
Ethiopian Highland: A Strategy for Physical Recovery (2003) Kalamazoo, Michigan
1-9.
- Harris JM, Roach B, Harris JM and Roach B. Global
Climate Change: Science and Economics (2018) Env Natural Resource Economics
306-334. https://doi.org/10.4324/9781315620190-12
- Nega B, Adenew B and Sellasie GS. Current Land Policy Issues in Ethiopia (2002) In Land Reform. Land Settlements and Cooperatives.
Corresponding author
Temima Ibrahim, Department of Forestry, College of
Agriculture, Wollo University, Dessie, Ethiopia, E-mail: temibra@gmail.com
Citation
Ibrahim T, Geremew B and Tesfay F. Spatio-temporal
dynamic of land use and land cover in Andit Tid watershed, wet
frost/afro-alpine highland of Ethiopia (2021) Edelweiss
Appli Sci Tech 5: 33-38.
Keywords
Andit Tid watershed, Land use/land cover, Population
increase, Landsat images and Plantation forest.
